Shared Sensor Calibration Logs Reveal Legacy Device Pairings in Industrial Dashboards
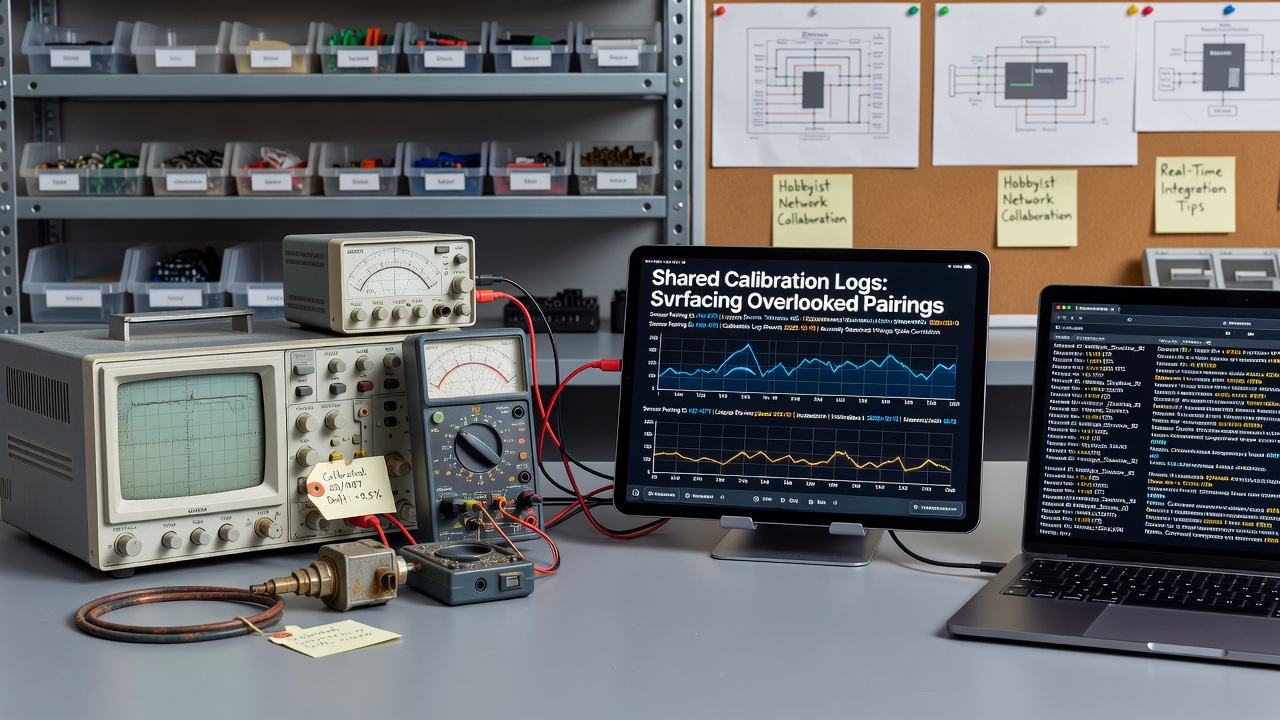
Networks of hobbyists have begun exchanging detailed sensor calibration logs through dedicated online repositories, and these exchanges have started to highlight unexpected compatibilities between older measurement hardware and contemporary data visualization platforms used in industrial settings. Observers note that many legacy devices, once considered incompatible with modern dashboards, now appear viable after calibration data gets mapped against real-time parameters such as temperature drift, voltage stability, and signal latency. In July 2026 several repositories recorded a spike in shared entries that documented successful pairings between 1990s-era pressure transducers and current cloud-based monitoring suites.
How Calibration Data Moves Through Hobbyist Channels
Participants upload raw calibration sequences that include timestamped readings, environmental conditions, and adjustment coefficients, while others download and test the same sequences against their own equipment inventories. These exchanges occur on forums and file-sharing sites that specialize in industrial automation rather than consumer gadgets, and the logs often arrive formatted in open standards like CSV or JSON that visualization tools already accept. Researchers from technical universities have tracked how one particular log set for a discontinued flow meter aligned directly with a dashboard module designed for newer sensors, allowing users to bypass custom middleware entirely.
Legacy Devices Finding New Roles in Real-Time Systems
Many industrial facilities still operate measurement instruments installed decades ago because replacement costs remain high, yet operators seek updated visualization without full hardware swaps. Calibration logs shared among hobbyists have surfaced cases where devices from the early 2000s feed accurate data into dashboards that render live trends and alerts, provided the calibration offsets get applied correctly at the input stage. One documented instance involved a set of analog strain gauges paired with a subscription analytics platform after hobbyists cross-referenced their logs with the platform's API documentation, resulting in stable readings across temperature swings of 40 degrees Celsius.
Patterns Emerging from Aggregated Log Collections
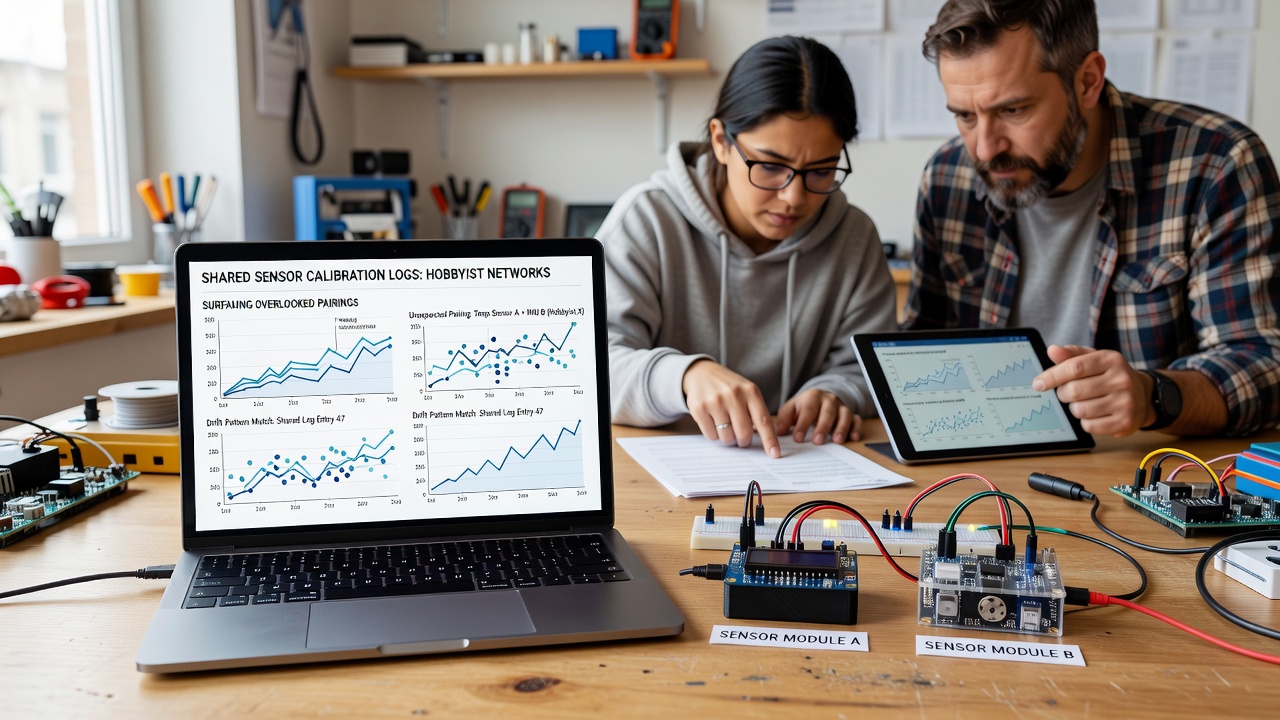
When multiple contributors pool their calibration records, common compatibility signatures begin to appear across device families that manufacturers never officially supported together. Data indicates that signal conditioning parameters for certain legacy voltmeters match the input ranges of dashboards built for wireless IoT nodes, allowing direct integration once scaling factors are applied. Academic studies published through European research consortia have quantified how these shared datasets reduce the engineering time needed to validate new pairings, with some teams reporting validation cycles shortened from weeks to days.
Practical Steps Hobbyists and Operators Follow
Users start by posting calibration curves that list input values against expected outputs under controlled conditions, then tag the entries with hardware model numbers and dashboard software versions. Others search these tags to locate matching profiles, download the associated scripts, and apply them in test environments before moving to production monitoring stations. According to documentation maintained by the Industrial Internet Consortium, such community-driven mapping has already supported integration projects in sectors ranging from water treatment to small-scale manufacturing where budget constraints limit full system overhauls.
Technical Considerations That Determine Success
Successful pairings depend on matching communication protocols, power requirements, and data formats between the older sensor and the newer dashboard layer, yet calibration logs supply the missing conversion tables that bridge these gaps. Hobbyists frequently include notes on required resistor networks or amplifier stages that restore signal integrity, allowing the dashboard to interpret readings without additional hardware. Those who've studied these exchanges report that the most reusable logs contain both raw and processed data streams, giving downstream users flexibility to choose filtering approaches that suit their specific industrial noise environments.
Broader Effects on Monitoring Practices
Facilities adopting these community-identified pairings gain extended operational visibility without immediate capital expenditure, and the shared logs continue to accumulate as more operators contribute their own test results. This growing body of documentation creates feedback loops where initial pairings receive further refinement from subsequent users who encounter different operating conditions. Government agencies tracking industrial efficiency have begun referencing such community resources when updating guidelines on equipment lifecycle extension, noting the role of distributed calibration data in maintaining measurement accuracy across mixed-generation hardware.
Conclusion
Shared calibration logs among hobbyist networks continue to map connections that link legacy measurement devices with real-time visualization dashboards, expanding options for industrial monitoring setups that rely on existing infrastructure. The process relies on open exchange of detailed records, consistent tagging practices, and iterative testing that turns isolated compatibility discoveries into reusable integration patterns across multiple sectors.